Value Management: ARC Diagnostics
ARC Diagnostics structure and securely present Value Codes online to any number of respondents to evaluate – potentially to 100s or even 1000s of participants, to instantly achieve:
- Engagement at scale.
- A sense of ownership.
- Diversity and inclusion.
After deciding on the object and focus of the Diagnostic – principally by understanding the Perceptual Position involved as appropriate to Ecosystem and Lifecycle considerations – an automated process of invitations and reminders leads to responses being submitted by participants.
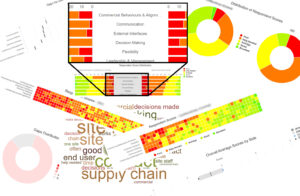
After this, detailed and incisive reports are generated that rapidly clarify perspectives, issues and priorities – both reflecting the particular Perceptual Position taken and giving insights into the others:
- Each respondent’s report confirms their own perspective, and the organisation’s overall perspective is synthesised.
- Where multiple parties are involved, each party can understand the other’s perspective.
- The reports act as the “objective observer”, replaying and interpreting what is being said.
- It is even possible to synthesise and aggregate reports to provide overarching, “systemic” insights (e.g. across an Ecosystem or industry sector).
Rather than the time taken to gather and inputs and achieve all this through e.g. consultant interviews and analysis – where only a fraction of those involved are typically engaged, the process can take months, and things move on in the meantime – all this can be achieved in just several weeks.
Within this, the presentation of the Value Codes and the nature of the reports vary as appropriate to the Value Mode, and can be further augmented by AI analysis.
ARC Diagnostics can be repeated as often as needed – regularly or ad hoc – to drive action, gauge progress, and embed, spread and scale change.
The result? Alignment, Resilience and Coherence – ARC.
How ARC Diagnostics Work
All ARC diagnostics have the same core functionality and user interface for respondents:
- Secure online access, where all that each user needs is a unique login name and password, and where the default is for responses and comments to be unattributed.
- Presentation of what is being evaluated in sections, where respondents capture their feedback on a slider-bar of evaluation choices that often have more detail to explain them.
- Comments can be added and, if enabled as appropriate to the Value Mode, gathering of supporting evidence.
Behind the scenes, invitations to participate, reminder mails and confirmation mails are all automated around configurable deadlines.
Moreover, respondents belong to organisations and can optionally be tagged with roles – departments, functions, etc – to further refine later analysis, whilst diagnostics live within a structure of projects to group related diagnostics (e.g. to compare output between related assessments).
Individuals can check their own progress, whilst administrators can check overall progress.
Upon completion, each respondent gets a report on their own response, which can later be used to compare with any overall picture.
Reports That Drive Insight and Action
Upon conclusion of the diagnostic process – when all responses are complete and/or the deadline reached – overall reports are generated:
- Reports are either available interactively online, as PDF downloads, or both.
- Standard reporting includes averages, evaluation distributions, perception gaps, and drilling-down from summary information into specifics, comparison of organisation perspectives, etc.
- Enhanced reporting can include role-based reports, downloads of raw data (e.g. to allow further processing in Excel), comparisons of different diagnostics or mappings to other sources (e.g. to gauge progress against, or relevance to, them).
There is also optional functionality for reviewing, rating and tagging comment-based feedback to generate a taxonomy of what has been uncovered, together with targeted AI analysis to further enhance insights.
All this is done in a way that is appropriate to the type, purpose and lifecycle stage of each individual situation – i.e. the Value Mode.
Moreover, the output provides context for appropriate and selective deployment of familiar and conventional approaches (which of course still have their place), but where they are no longer the unconscious default.
Responding to a Diagnostic:
Featured content:
Articles related to Diagnostics:

The Current Cutting Edge?
Is This Really The Current Cutting Edge? I recently attended a two-day event for collaborative working professionals and one session on the agenda particularly caught my eye. It was billed as an overview of how a leading pharmaceutical company sought to obtain an “aligned and nuanced” overview…


Diagnostics are NOT Surveys
Diagnostics are NOT Surveys Often confused with a “survey”, a “diagnostic” is something very different. Whilst the interface may look similar – a set of parameters for respondents to evaluate on a scale with a range of options, leading to some consolidated output – the purpose is…


Mastering Complexity: Part 3
Mastering Complexity: Part 3: Harnessing Complexity Introduction Part 1: What Complexity Is Part 2: Complex vs Complicated Part 3: Harnessing Complexity We began this series (Part 1) by establishing that today’s global business environment is highly Complex, but saw last time (Part 2) how accepted “wisdom” instead persists in treating…
